
Decisions about analytics platforms in large organizations are increasingly tied to broader strategic goals around data governance, AI integration, and long-term platform consistency. The comparison between Databricks vs Power BI is not simply about dashboards or visual appeal; it reflects fundamental questions about where analytics lives in the modern enterprise data stack and how it supports advanced use cases.
The business intelligence market itself has been expanding for years. In 2025, the global BI market was valued at around USD 34.8 billion, with projections indicating growth toward more than USD 70 billion by 2034 on a mid-range compound annual growth rate of around 8% – 9% annually. Within that growth, Power BI has established a significant presence. Estimates place Power BI’s share of the analytics and BI segment at roughly 30% globally, and the platform is used by a large portion of Fortune 500 organizations.
Similarly, Tableau holds a measurable slice of the BI landscape, with around 12% – 13% market share in industry reports focusing on 2025 data. These figures underline that traditional BI tools remain essential to enterprise workflows, but they also highlight a fragmented environment in which multiple platforms coexist, mostly without deep architectural integration.
How Power BI and Tableau Support Enterprise Analytics Today
Power BI’s adoption has been driven by its integration with Microsoft technologies, its relatively low barrier to entry, and its scalability for both departmental and enterprise-wide deployments. Its modeling capabilities through DAX enable complex business logic to be embedded within dashboards, allowing analysts to define measures that directly reflect organizational KPIs. Power BI’s ecosystem also supports collaboration and sharing across distributed teams.
Tableau’s strength lies in flexible visual exploration. Users can build rich, interactive dashboards that support detailed analytical workflows. For teams focused on deeper data investigation, Tableau has been a go-to platform.
However, neither tool was designed as a unified data and AI execution environment. Their primary purpose has been to bring insights into a consumable, visual form for business stakeholders and analysts who need to interpret data quickly.
This design has worked well in environments where the BI layer operates on top of data that is already curated and transformed upstream. But enterprises that are building toward tighter integration between analytics and operational systems are looking at this architecture with fresh scrutiny.
Shifts in Data Architecture and Analytics Strategy
As enterprises broaden their analytical footprint, they also expand their requirements for governance, data quality, and AI-enabled workflows. Databricks has become a preferred platform in many large organizations for building data pipelines, running machine learning models, and creating governed data assets through its Lakehouse architecture.
Industry data shows that enterprise AI adoption is accelerating 10X YoY as organizations shift from experimentation to production-scale models.
This trend places pressure on traditional architectures where analytics, BI, and AI operate in silos.
In many enterprises, ML models are developed in Databricks while business reporting lives in BI platforms. When these reports need to be consumed by business users, they are often replicated into tools like Power BI or Tableau, introducing governance and maintenance complexity.
Databricks vs Power BI: Architectural Implications
Comparing Databricks and Power BI at an architectural level involves looking beyond surface features to observe how each platform interacts with data pipelines and analytical logic.
Power BI is a BI engine that connects to various data sources and maintains its own semantic model. Its strength is visualization and self-service reporting, but it does not inherently unify the data execution and governance layers with the underlying storage and compute infrastructure.
Databricks AI/BI, on the other hand, operates directly on the Lakehouse, where Delta tables store data and Spark SQL processes queries. Governance is centralized through mechanisms like Unity Catalog, and the data, ML workflows, and analytics share the same execution environment. Dashboards running on Databricks AI/BI query the same data that was prepared and governed within the platform, reducing layers of duplication.
This difference becomes more material as organizations execute against more advanced analytical use cases. For enterprises that have migrated to Databricks for data engineering, transformation, and model deployment, consolidating analytics inside the same platform supports tighter integration between workflows and governance enforcement.
Databricks vs Tableau: A Parallel Evaluation
The comparison with Tableau follows similar reasoning. Tableau’s interface and visual capabilities are well regarded, particularly for detailed exploration. Like Power BI, Tableau exists as a layer above the data platform. It expects well-defined data models and curated sources, whereas Databricks AI/BI incorporates governance, compute, and analytics without requiring separate semantic engines.
For organizations standardizing a Lakehouse strategy, this convergence simplifies governance, reduces context switching for analytics teams, and aligns reporting more closely with operational data systems.
Power BI vs Tableau vs Databricks AI/BI | Architectural Comparison
| Category | Power BI | Tableau | Databricks AI/BI |
|---|---|---|---|
| Platform Type | BI tool with a semantic model | Visualization & analytics platform | Unified Lakehouse (Data + AI + Analytics) |
| Compute Engine | VertiPaq + DAX | Hyper engine | Spark SQL (distributed) |
| Data Model | Import / DirectQuery / composite | Live connections or extracts | Delta Lake (native Lakehouse) |
| Semantic Logic | DAX in the dataset | Calculated fields in workbooks | In Lakehouse transformations |
| AI Integration | External ML integration | External ML integration | Native ML + Feature Store |
| Governance | Workspace / dataset-level | Project/data source-level | Unity Catalog (platform-level) |
| Scalability | Optimized for curated datasets | Performance depends on the extract strategy | Petabyte-scale workloads |
| Best Fit | Microsoft ecosystem reporting | Analyst-led exploration & storytelling | AI-driven, Lakehouse-first enterprises |
Challenges in Migration
Despite the strategic rationale for moving analytics inside Databricks, migration is often perceived as a complex undertaking. Mature Power BI and Tableau deployments contain deeply nested logic, a large number of dashboards, custom visuals, and access policies. Reconstructing these artifacts manually introduces the risk of metric drift, inconsistent definitions, and long execution timelines.
This migration complexity is one reason some organizations delay modernization, even when the architectural benefits are clear.
Syren’s Tab2Lake & PBI2Lake Databricks AI/BI Migration Accelerator
Addressing this challenge, Syren has developed a Databricks-native AI/BI Migration Accelerator specifically for enterprise-scale transitions. The accelerator automates many of the technical steps involved in moving dashboards from Power BI and Tableau into Databricks AI/BI, retaining semantic fidelity and governance.
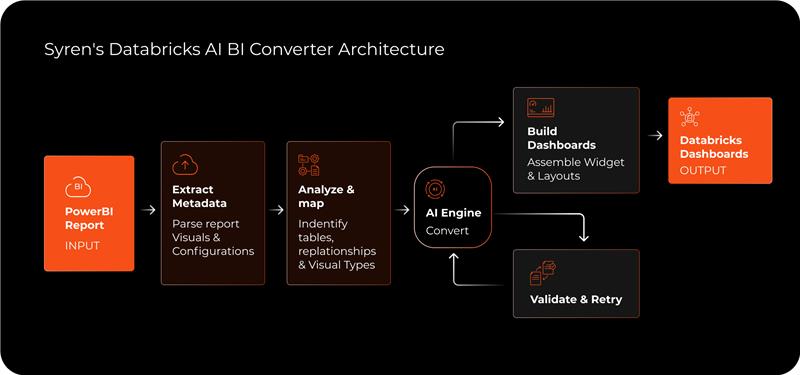
The migration process includes:
- Metadata extraction from Power BI PBIX files and Tableau workbooks
- Reconstruction of table relationships and dependencies to reflect logical joins and filters
- Conversion of embedded calculations into optimized Spark SQL aligned with Delta Lake schemas
- Mapping of visual elements to Databricks AI/BI dashboard equivalents with preservation of measures, filters, and hierarchical structures
- Automated validation loops to ensure query performance and correctness before production deployment
By enabling automation of a large share of the workload, Syren’s Tab2Lake & PBI2Lake accelerators make migration more predictable and efficient. Many enterprise environments see a significant proportion of dashboards, often estimated between 80% and 90%, migrated with minimal manual intervention, leaving only edge cases for targeted refinement.
Closing Perspective
Tools like Power BI and Tableau have played massive roles in enabling organizations to visualize data and democratize insights. Their continued adoption reflects their utility for many reporting scenarios.
At the same time, a broader trend toward unified analytics platforms that bring together data engineering, AI, and visualization is underway. Databricks AI/BI represents one direction of that convergence, and structured migration strategies supported by accelerators like Syren’s can help enterprises navigate the transition with clarity and governance intact.
To learn more about migrating from Tableau or PowerBI to Databricks AI/BI, contact us.