Key Takeaways
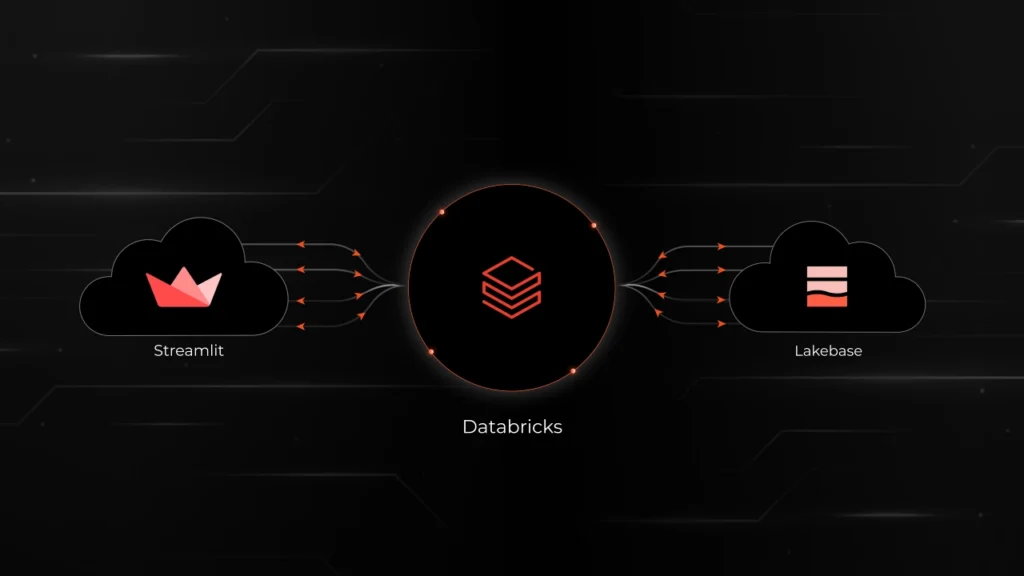
- A fully functional Warranty Registration app was built and deployed in a single day using Streamlit, Databricks Lakebase, and Databricks Apps — with only three files.
- Lakebase compute scales to zero when idle and wakes up in under 500ms, directly reducing compute spend for intermittent workloads.
- No EC2 instances, VPC configuration, backup scripts, or ETL pipelines were required. Transactional data is immediately queryable via Unity Catalog for analytics.
- For enterprises already on Databricks, Lakebase eliminates a separate database platform, a separate monitoring stack, and the operational overhead that comes with both.
The Problem: Database Costs That Nobody Is Watching
Database costs are a consistent line item in cloud spend reviews. Engineering teams' provision RDS or Cloud SQL instances during a sprint, configure them once, and move on. Months later, a db.r5.xlarge is running 24/7 for an internal tool that handles 30 requests per day. The instance was never right-sized. Nobody set up scale-to-zero. It has been running and billing continuously ever since.
This pattern repeats across organizations that have accumulated dozens of internal tools, dashboards, and early-stage products, each backed by its own always-on database instance. The cost is not from any single instance. The cost is from the aggregate.
When Databricks launched Lakebase, a fully managed Postgres that autoscales and can suspend to zero, Syren's cloud architecture team ran a structured evaluation. The goal was not a benchmark against sample data. The goal was to build an actual working application that creates tables, writes rows, reads them back, and survives compute restarts.
What is Databricks Lakebase? (and How It Differs from RDS)
Lakebase is managed Postgres that lives inside a Databricks workspace. Applications connect using standard Postgres drivers. There is no EC2 provisioning, no security group configuration, no VPC peering, and no separate backup setup.
The key architectural differences between Lakebase and traditional managed databases:
- Compute autoscales between a configurable minimum and maximum CU range (each CU provides approximately 2 GB of RAM).
- Scale-to-zero suspends compute entirely when no queries are active. Storage remains intact; data is not lost. When the next query arrives, compute restarts in under 500ms.
- Tables are registered in Unity Catalog and queryable alongside Delta tables — eliminating the ETL pipelines organizations typically build to move OLTP data into the lakehouse.
- Authentication uses OAuth tokens generated per connection via the Databricks SDK, refreshed automatically on each new connection.
For teams already using Databricks for analytics or ML, Lakebase removes a separate database platform, a separate credential rotation process, and a separate networking configuration to maintain.
Building the Test Application: Warranty Registration System
The test application chosen was a Warranty Registration System, a standard CRUD application representative of the internal tools and early-stage products common across manufacturing and enterprise environments.
The application includes three functional areas:
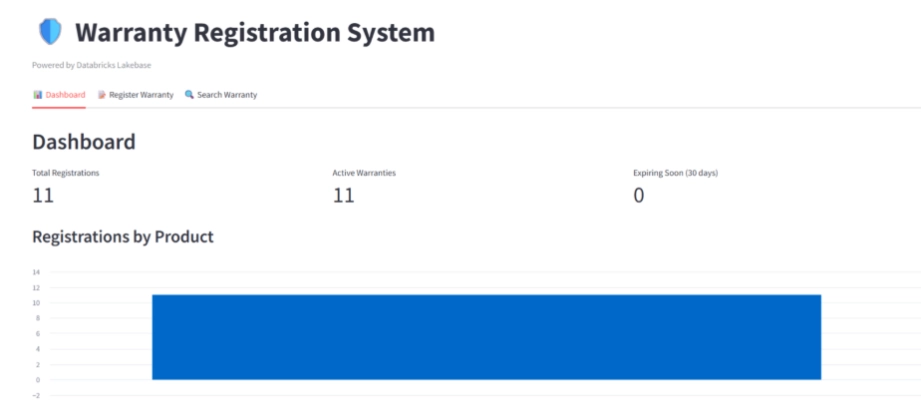
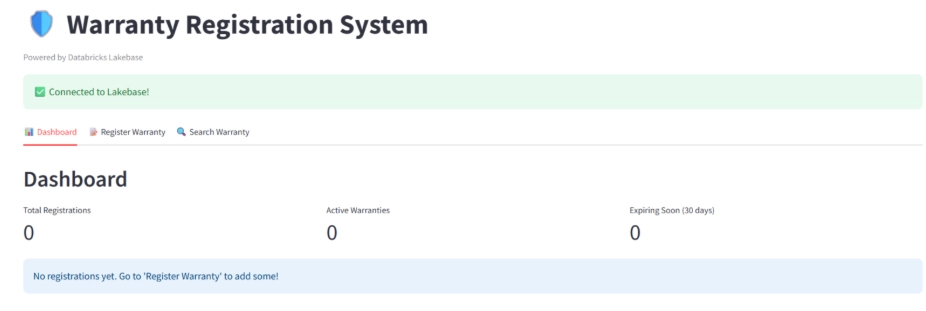
- Dashboard: Total registrations, active warranties, and expiring-soon counts. A bar chart breaks down registrations by product category.
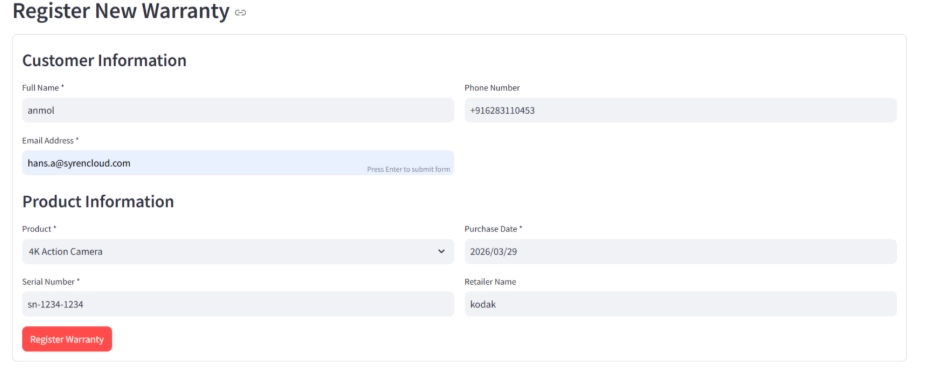
- Register Warranty: A form capturing customer name, email, product, serial number, and purchase date. On submission, the app calculates warranty expiry based on product-specific warranty periods and writes the record to Lakebase.
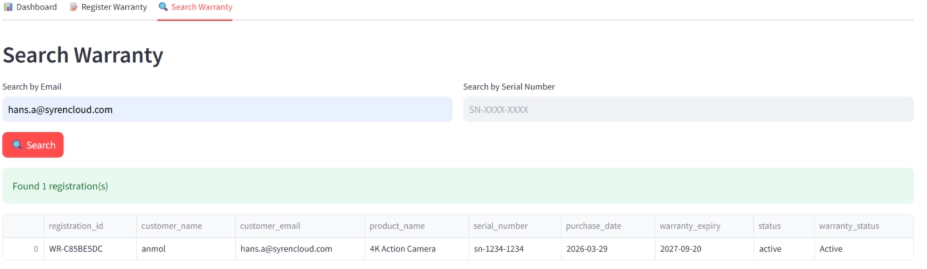
- Search Warranty: Lookup by email or serial number, returning product details, purchase date, expiry date, and current warranty status (Active, Expiring Soon, or Expired).
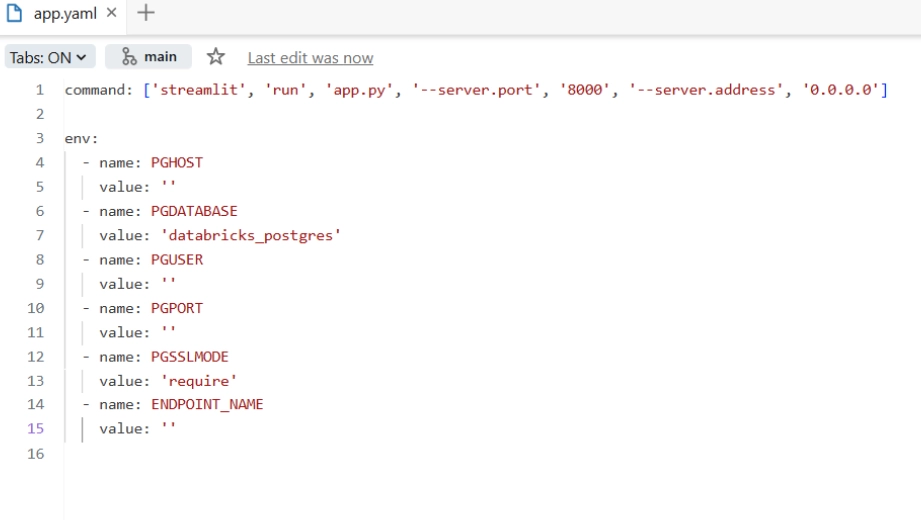
The entire application was deployed with three files: app.yaml, app.py, and requirements.txt. Deployment time from file upload to live app was two to three minutes.
Step-by-Step: Setting Up Lakebase and Configuring Compute
1. Creating the Lakebase Project
Navigate to Compute in the Databricks workspace, select Lakebase, choose Autoscaling, and click Create Project. After naming the project and accepting Postgres 17 as the engine, the production branch with a primary compute is live within approximately one minute.
2. Configuring Compute for the Actual Workload
The production branch ships with an 8–16 CU autoscaling range and scale-to-zero disabled. This is appropriate for always-on production services with consistent traffic. For internal tools, dashboards, and early-stage applications, the range can be tuned significantly lower.
In this evaluation, the primary compute was edited and dropped to a 0.5–1 CU range (1–2 GB RAM). The Warranty Registration System ran without issues at this configuration. Monitoring confirmed CPU near zero and RAM well within limits throughout all testing.
Recommended compute sizing by use case:
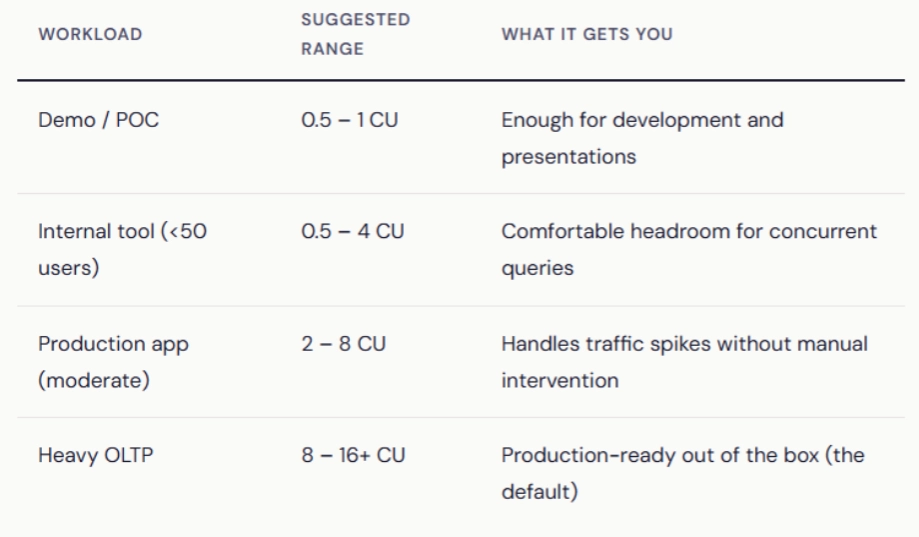
3. Enabling Scale-to-Zero
Scale-to-zero is available as a toggle in the Edit Compute dialog. For the production branch, it is off by default. In this evaluation, it was enabled with a 5-minute inactivity timeout.
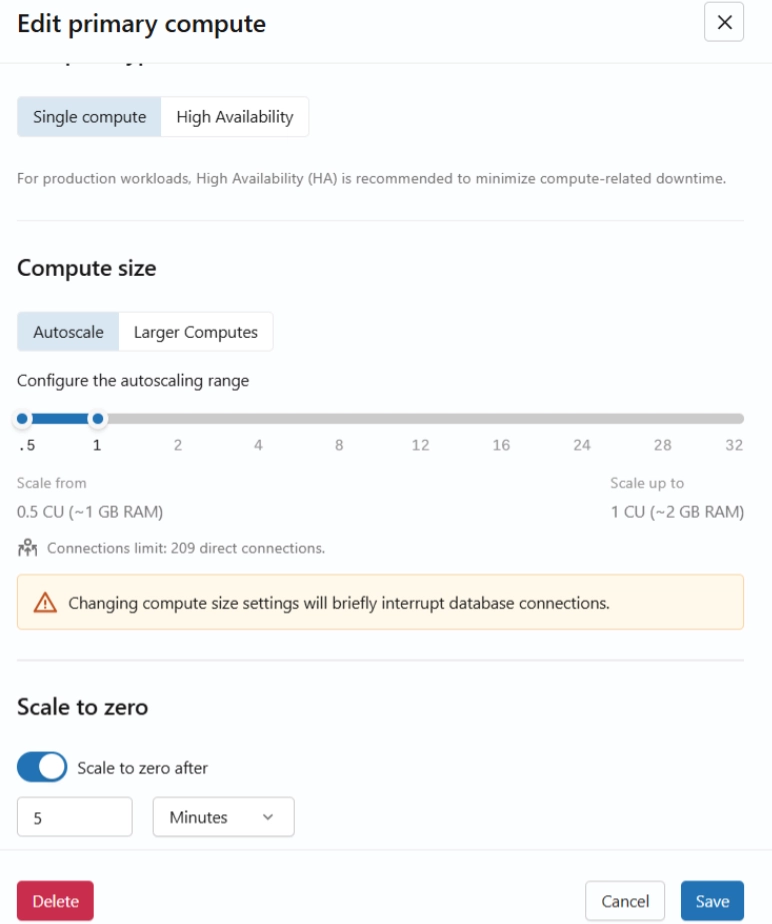
This is where the cost story gets interesting. With scale-to-zero enabled, the compute suspends when there are no active queries. Storage stays intact; data stays safe. When the next query comes in, the compute. For apps that are active during business hours and idle at night and weekends, this alone can cut compute costs significantly.
For production workloads with intermittent traffic, a 10–15 minutes timeout is recommended to avoid frequent start/stop cycles. For development environments, 10–30 minutes balances responsiveness with cost reduction.
4. Collecting Connection Details and Granting Access
Two values are required from the Lakebase UI before connecting an application:
- PGHOST: The endpoint hostname, available from the Connect modal.
- ENDPOINT_NAME: The resource name in the format projects/{project}/branches/{branch}/endpoints/primary, available from Get ID on the primary compute.
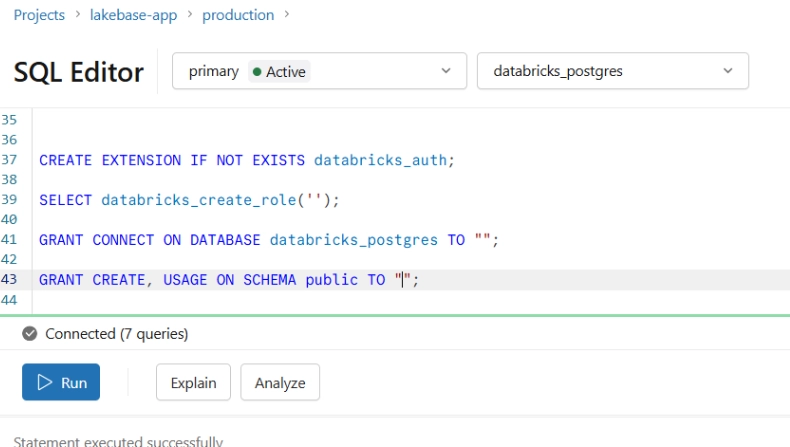
Database access is granted to the application's service principal via the Lakebase SQL Editor before deploying the app.
5. Deploying the Application
The Databricks documentation covers the Streamlit + Lakebase pattern well. But here’s the connection sequence that avoids common errors:
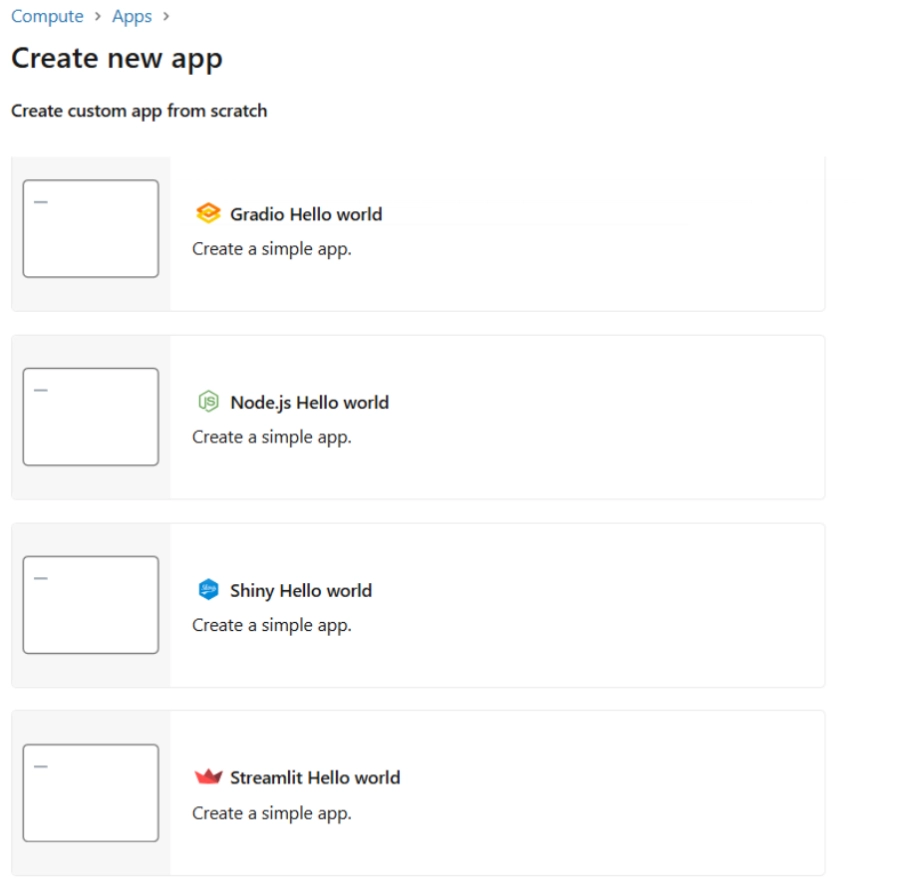
1. Create the app in the Databricks workspace (New > App). Retrieve the DATABRICKS_CLIENT_ID from the Environment tab — this UUID is the application's identity for OAuth.
2. Grant database access to the app's service principal in the Lakebase SQL Editor.
3. Configure app.yaml with Lakebase connection details, PGHOST, and ENDPOINT_NAME.
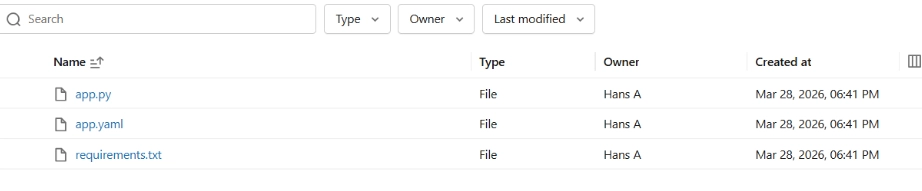
4. Deploy the three application files. The app is live in two to three minutes.
The app has three tabs:
Dashboard: Total registrations, active warranties, and expiring-soon count at a glance. A bar chart breaks down registrations by product. The first thing seen when the app loads.
Register Warranty: A form where customers enter their name, email, product, serial number, and purchase date. On submit, the app calculates the warranty expiry based on the product's warranty period and writes it to Lakebase.
Search Warranty: Look up any registration by email or serial number. Results show the product, purchase date, expiry date, and current warranty status (Active, Expiring Soon, or Expired).
The authentication uses psycopg3 with a custom connection class that generates a fresh OAuth database credential via the Databricks SDK for each connection. Tokens expire hourly, but since every new connection gets a fresh token, this is handled transparently.
Cold Start Performance: Measured Results
Scale-to-zero eliminates compute cost during idle periods, but introduces a cold start delay on the first request after suspension. This is the tradeoff that determines whether scale-to-zero is appropriate for a given application.
Testing methodology: Warranties were registered while compute was warm. The application was left idle until the System Operations tab confirmed a Suspend Compute event. A search was then performed to trigger a cold start.
| Operation | Measured Duration |
|---|---|
| Compute start (cold) | 370 – 465 ms |
| Compute suspend | 256 – 292 ms |
| Full user experience (click to results) | ~2–3 seconds (includes OAuth + query) |
The full user-facing experience — from clicking Search to seeing results — was approximately 2–3 seconds. This includes OAuth token generation, compute startup, Postgres connection establishment, and query execution. On a warm compute, the same operation completes in under one second.
For internal tools, back-office applications, and dashboards that sit idle between uses, a 1–2 second cold start overhead in exchange for hours of eliminated compute cost is a favorable tradeoff. For customer-facing applications with strict latency SLAs, scale-to-zero should be disabled or the inactivity timeout set long enough to keep compute warm during expected usage windows.
What the Built-in Monitoring Revealed
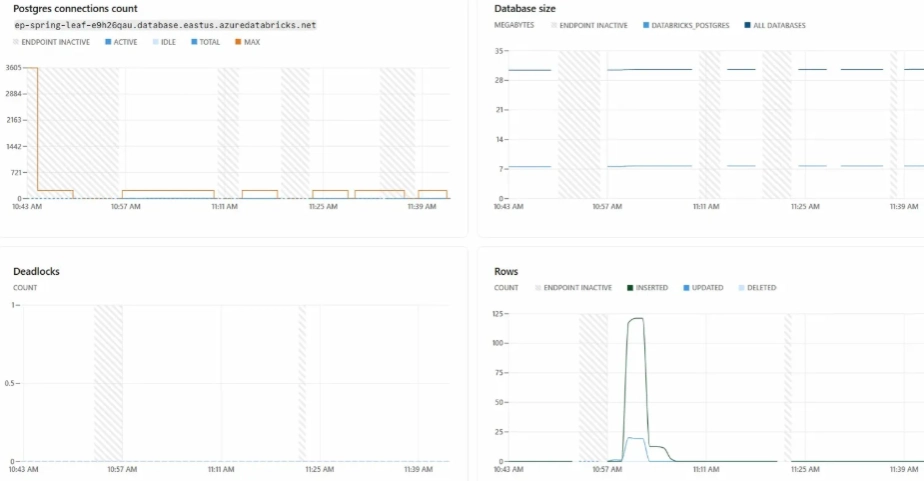
Lakebase includes a Monitoring tab with metrics that would typically require a separate CloudWatch or Grafana setup. Four metric categories were observed during this evaluation:
- RAM and CPU: Both remained near baseline throughout testing at the 0.5–1 CU configuration, confirming the compute range was correctly sized. Flat utilization lines on a larger compute configuration are a signal that the instance can be scaled down.
- Connections: Active and idle Postgres connection counts over time. An issue was identified early in testing — the connection pool was maintaining open connections during idle periods, which prevented compute from suspending. This was resolved by configuring the pool to create connections on demand only.
- Row activity: Insert, update, and delete counts over time. Useful for verifying application behavior and identifying unexpected write patterns.
- System operations: A log of every compute start, suspend, and restart event with measured durations. This is where scale-to-zero behavior can be validated and actual cold start times confirmed.
Lakebase vs. Traditional Database Setup: Side-by-Side Comparison
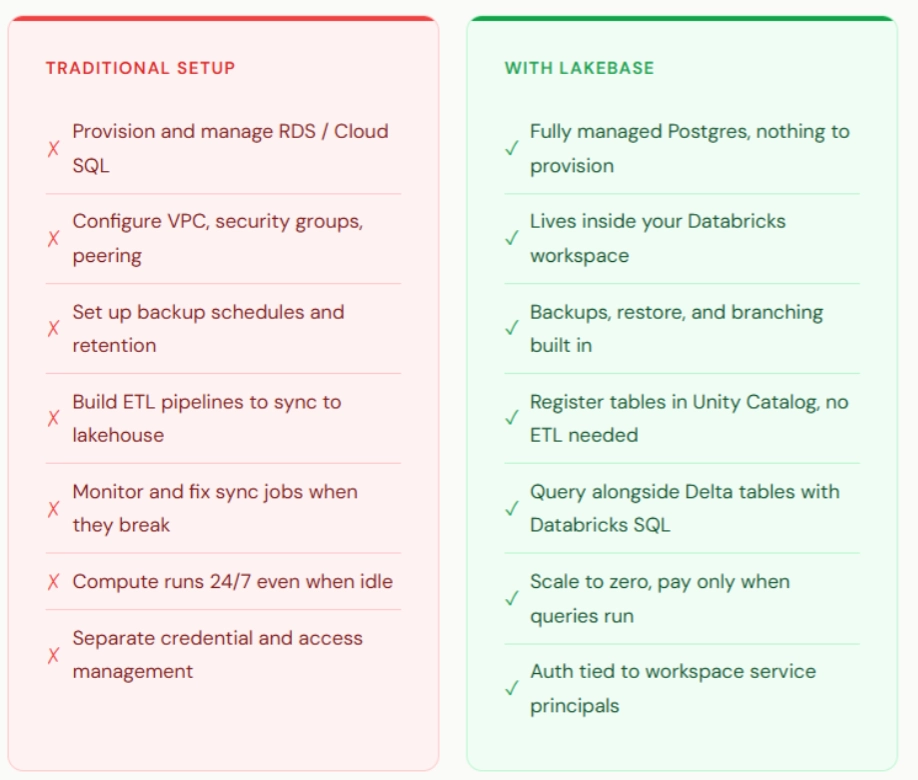
The compute cost reduction is the visible part of the comparison. The less visible part is engineering time. With a traditional setup, moving transactional data into the lakehouse for analytics requires building and maintaining ETL pipelines, writing them, scheduling them, monitoring them, and repairing them when they break. With Lakebase, tables registered in Unity Catalog are immediately queryable alongside Delta tables. No data movement, no pipeline maintenance, no manual synchronization.
For organizations that have engineering hours allocated to keeping OLTP and analytics databases in sync, that represents a reduction in both infrastructure cost and recurring operational burden.
When Lakebase Makes Sense
- Organizations already running Databricks for analytics or ML who want to consolidate database platforms.
- Internal tools, dashboards, and early-stage applications with intermittent usage patterns where scale-to-zero delivers meaningful cost reduction.
- Teams that want transactional data accessible for analytics without building and maintaining ETL pipelines.
- Environments where reducing operational overhead, fewer platforms, fewer credential rotations, fewer networking configurations, is a priority.
Conclusion
The evaluation set out to answer two questions: whether Lakebase could support a real working application, and whether the cost model holds up in practice.
On the first question: Lakebase is standard Postgres. Applications connect with existing drivers and existing query patterns. There is nothing new to learn on the application side. What is different is that the database infrastructure, provisioning, scaling, monitoring, backup, authentication, is managed within the Databricks workspace rather than configured and maintained separately.
On the cost question: A fully functional application ran on a 0.5 CU compute with scale-to-zero enabled. During idle periods, compute was suspended and cost was zero. For organizations with multiple internal tools each running their own always-on database instances, right-sizing and scale-to-zero reduce that cost materially. Adding Unity Catalog integration eliminates the ETL layer, which reduces both infrastructure spend and engineering overhead.
Syren helps enterprises evaluate and implement cloud data infrastructure decisions, including database platform consolidation, right-sizing strategies, and Databricks architecture. If your organization is evaluating Lakebase or looking to reduce database operational overhead, reach out to discuss your specific workload requirements.